
The ultimate goal of any business is to provide its customers with the products or services they need at the right time and right place (i.e., the customer’s desired location). From the business standpoint, this translates to maximizing revenue and is achieved in the retail world by furnishing the inventory with the right products and quantities at the right time. This is the goal of many efforts of the inventory management scientific community and practitioners in past decades. Being able to assess a retailer’s preparedness to satisfy unknown demand helps the retailer tremendously to efficiently manage its inventory to increase customer satisfaction and prevent lost sales but is very challenging because of the complicated relationship between the influential factors and the probabilistic nature of the problem.
Product demand is usually unknown, but with advances in digitization and digitalization, past sales data or even customers’ behaviors (like customers’ clicks and browsing history in e-commerce) are now available in most businesses and can be used to estimate some info about demand, such as the probability distribution of demand and its pertinent parameters. Hence, we mainly deal with uncertain demand rather than unknown demand. Using historical data and forecast methods, it is not difficult to estimate product demand shares with a reasonable error. Product demand shares are basic information about uncertain demand, which are in the form of ratios. The demand share of a product is the ratio of the expected demand for that product divided by the total expected demand across all products. In other words, a product demand share shows the probability that a customer demands the product.
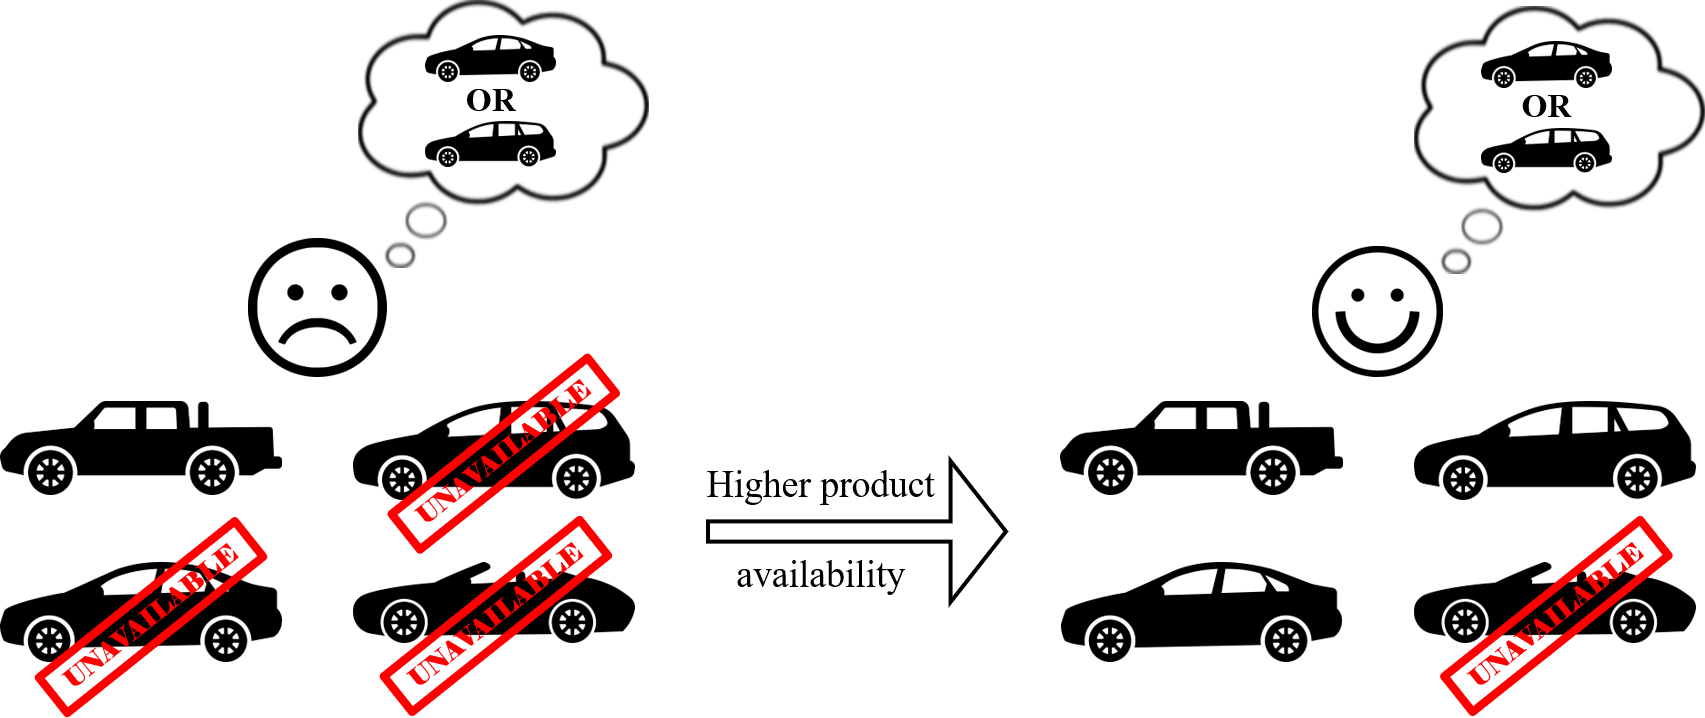
Assuming that product demand shares are independent of one another, one can easily use a retail center’s inventory to calculate the probability that it satisfies the next customer visiting the store. That is, using the probability rule of sum, the probability of satisfying the next customer visiting a store is the sum of demand shares of in-stock products. This probability reflects the preparedness of the retail center to satisfy demand. We call it Product Availability Ratio (PAR). When it comes to accurately assess this key performance indicator (KPI) in a real-world situation, we will find many other factors involved in the retailer and customer interactions that must be considered to ascertain the retailer’s responsiveness to demand. The following are some examples of such factors:
- Customer substitution: temporary stock-out and incomplete product availability are inevitable in most retailers. Customers are typically inclined to substitute a similar product for their desired one when it is not available. The substitution decision is probabilistic and most often depends on the similarity degree of the offered product to the customer’s preferred choice. Ignoring customer substitution results in underestimating the retailer’s preparedness and defective inventory planning.
- Demand uncertainty: product demand is uncertain and unknown in advance. We have partial information about demand from historical data and forecasts. This information is usually limited to historical sales data, which provides only partial (censored) information about demand because it does not show any info about stockout-based substitutions and lost sales. The historical sales data should be transferred into estimated demand, which is usually presented in the form of a probability distribution function.
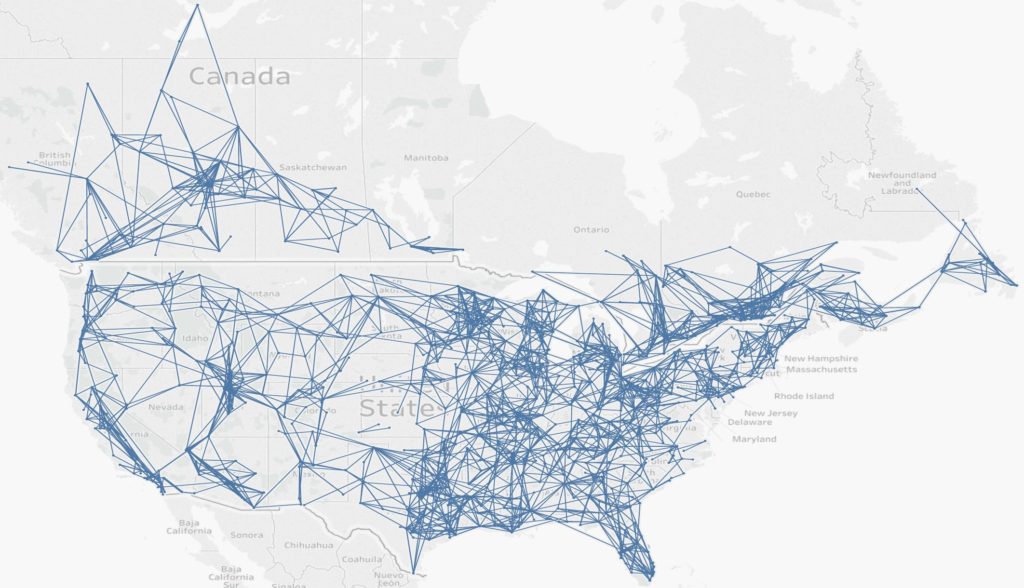
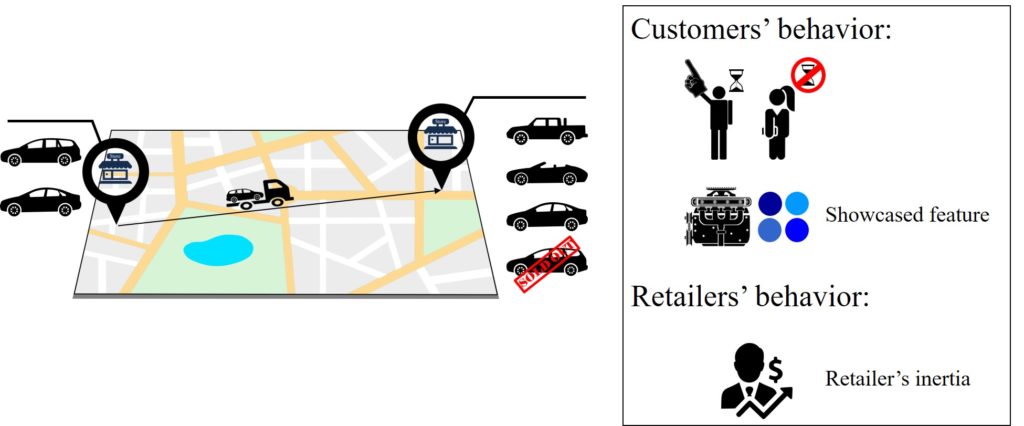
- Inventory transshipment: in today’s modern world, it is much easier and less costly for retailers to satisfy the demand for out-of-stock products by on-demand inventory transshipments from another retailer located within a reasonable distance (see Figure 1). An inventory transshipment is referred to the transfer of a product between locations of the same echelon (i.e., between two retail centers). We extend this definition to include on-demand priority orders from the firm’s distribution centers and OEMs. The possibility of offering a transshipment by a retailer and the probability of accepting it by a customer depends on three major factors (see Figure 2):
- Customers’ willingness to wait: transshipping a product takes some time depending on the distance, packaging operations, and paperwork. Some customers might be willing to wait to receive their desired product, while some might demand immediate purchase. The variant of waiting time differs in different industries. For example, the customers’ willingness to wait for luxury, high-value, and customized products such as sports cars are relatively larger than the acceptable waiting time for day-to-day products such as groceries or garments. The possibility of an inventory transshipment should be considered only for customers that are willing to wait, and their acceptable waiting time restricts the search radius for an on-demand transshipment.
- Showcased features in the retailers: customers like to test and experience some product features (such as color, engine, and platform in the car industry) in person before purchasing a product. Hence, the availability of some features of a potential transshipment among in-stock products positively influences the customer’s decision to accept the transshipment.
- Retailer’s inertia to offer a transshipment: transshipment costs play a significant role in a retailer’s decision to perform a transshipment. The further the item is, the more expensive it is to transship; therefore, transshipment becomes less desirable to the retailer as it becomes costlier, and the retailer may consider satisfying the customer by an in-stock substitute instead.
In a paper that I recently published in Omega with Benoit Montreuil and Guilhem Bau, we introduced the PAR concept considering all factors mentioned above. PAR extends the scope of product availability from in-stock to network availability while considering the influential factors involved in exploiting on-demand transshipments from both the customer’s and retailer’s perspectives. It measures the probability that a retailer satisfies future customers. It is expressed quantitatively as a fraction between zero and one, where values close to one reflect the retail center’s ability to provide any desired product within the customer’s acceptable time frame, while the reverse is true for values close to zero. The core of the PAR formulation, in a simple word, is an expected probability model. The probability of satisfying demand for a product in a retail store equals the probability of satisfying it by in-stock products or by an inventory transshipment. Using product demand shares to reflect the probability of demanding a product by a customer, PAR is obtained by: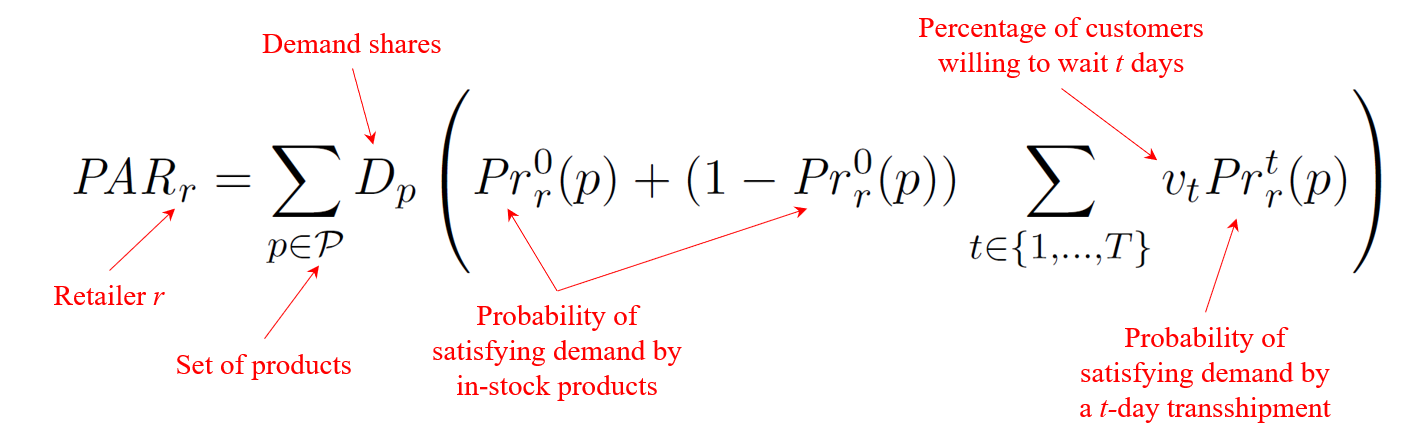
Product demand shares are inputs to the model. The probability of satisfying demand by in-stock products (immediate purchases) is computed by considering the possibility of an exact match or a satisfactory substitute. We used a logistic function to model the probability of a customer accepting a substitute based on the similarity between products, which is obtained by comparing pairs of products with respect to different product features such as engine, color, and platform in the car industry. The probability of satisfying demand by transshipment is computed by considering showcasing features in the retail center, retailer’s inertia, and customer’s willingness to wait.
Similar to customer substitution behavior, we used a logistic function to model customers’ probabilistic behavior to accept a transshipment based on the showcasing features in the retail center. To account for the retailer’s inertia, the model restricts the available alternatives based on the distance and the incremental customer satisfaction gained by undergoing a longer-distance transshipment compared to a closer alternative. Finally, the model restricts transshipment alternatives for different customer groups to only alternatives that can be delivered within the acceptable waiting time.
The suitability of the model components and assumptions regarding customers’ and retailers’ behaviors were supported by the results of a survey conducted among more than 160 dealerships of our industrial partner, a recreational vehicle manufacturer, across the United States and Canada.
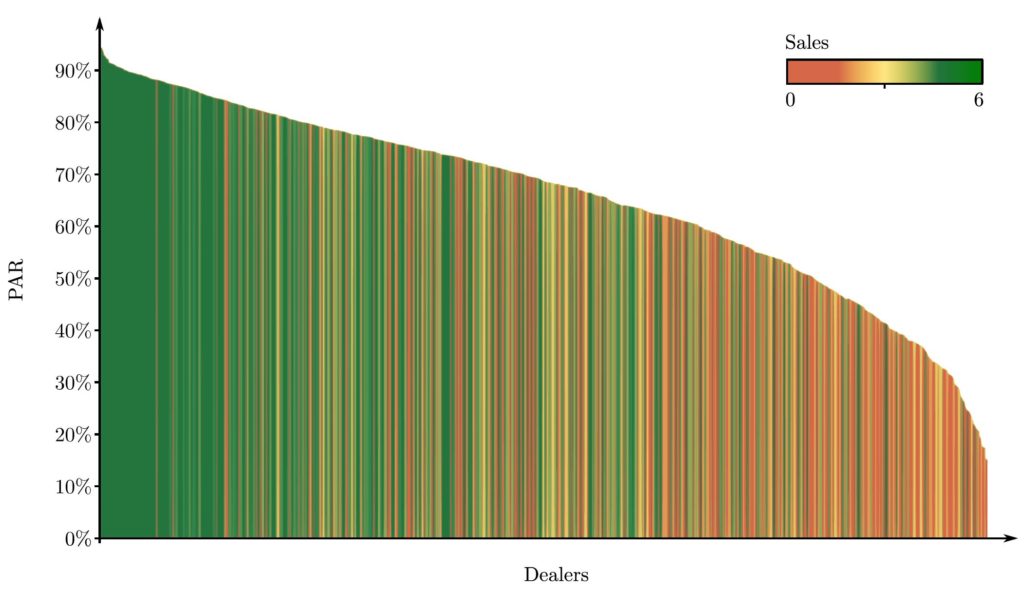
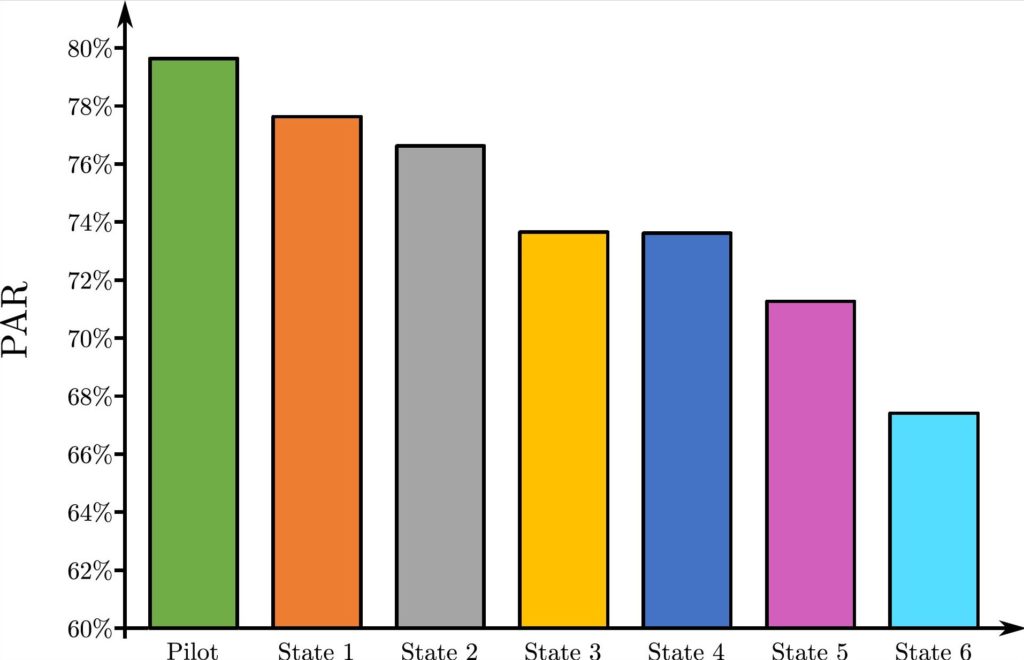
We evaluated the effectiveness of the model through a one-year pilot study in 17 dealerships of our industrial partner. We used the expected correlation between the PAR and sales and fine-tuned the parameters of the model using past sales and inventory logs (Figure 3).
We used the model to assess and improve product availability in the selected dealerships. We used the model in a heuristic greedy algorithm to replenish the products that would maximize PAR in the dealerships (Figure 4).
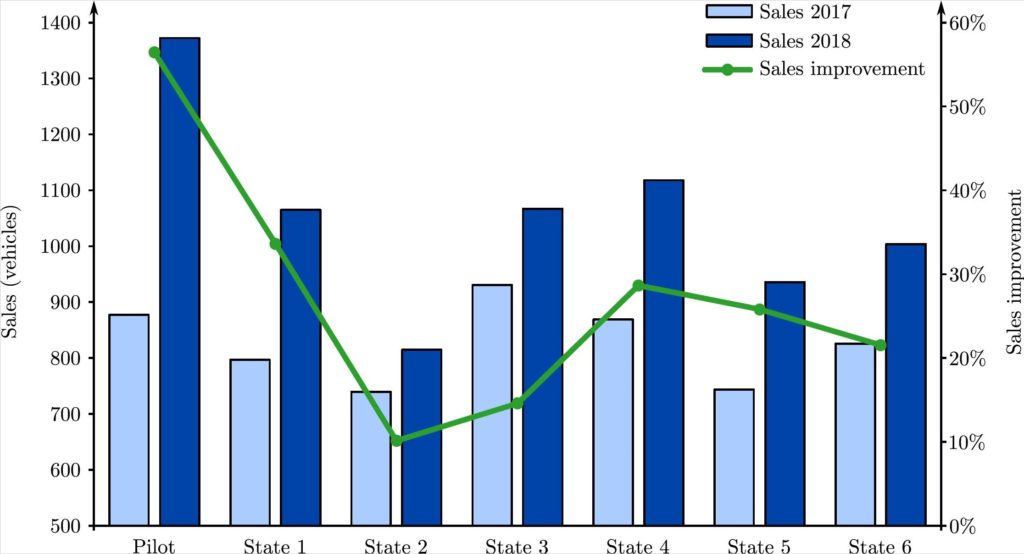
Our analysis showed that using our model to enhance product availability resulted in a 54% increase in annual sales of the pilot state, while the company experienced a 22% sales increase that year for the studied product lines in the rest of the United States (Figure 5). The pilot state achieved the highest sales improvement in North America. This was achieved while the inventory turnover of the pilot state also improved more than 16% compared to the past year.
PAR benefits retail networks in two ways. First, it can be used to accurately assess the inventory of retail centers as a function of potential sales. Second, it can be used in a core of optimization algorithm to plan and manage inventory in a retail distribution network and appropriately diversify inventory profiles across the network.
For more details about the model, survey results, and experiments, please download the paper from Omega or here.
Hi
Thank you very Much.This info is very helpful.